


Every new home in England and Wales leaves a paper trail when it first sells, flagged in the Land Registry record as a new build. We added them all up across the years 2018 to 2026 and found almost 800,000 of them. Plotted by postcode, those sales draw a sharp picture of where modern Britain is actually being built, and it is not where you might think.
How We Counted
We took every sale in the HM Land Registry Price Paid record marked as a new-build property and grouped them by outward code, the first half of the postcode. New builds make up just under 10 percent of all sales nationally, so any postcode where they make up half or more of the market is a place going through serious change. We have looked at it two ways: the raw number of new homes sold, and the share of the local market they account for.
The Biggest Builders
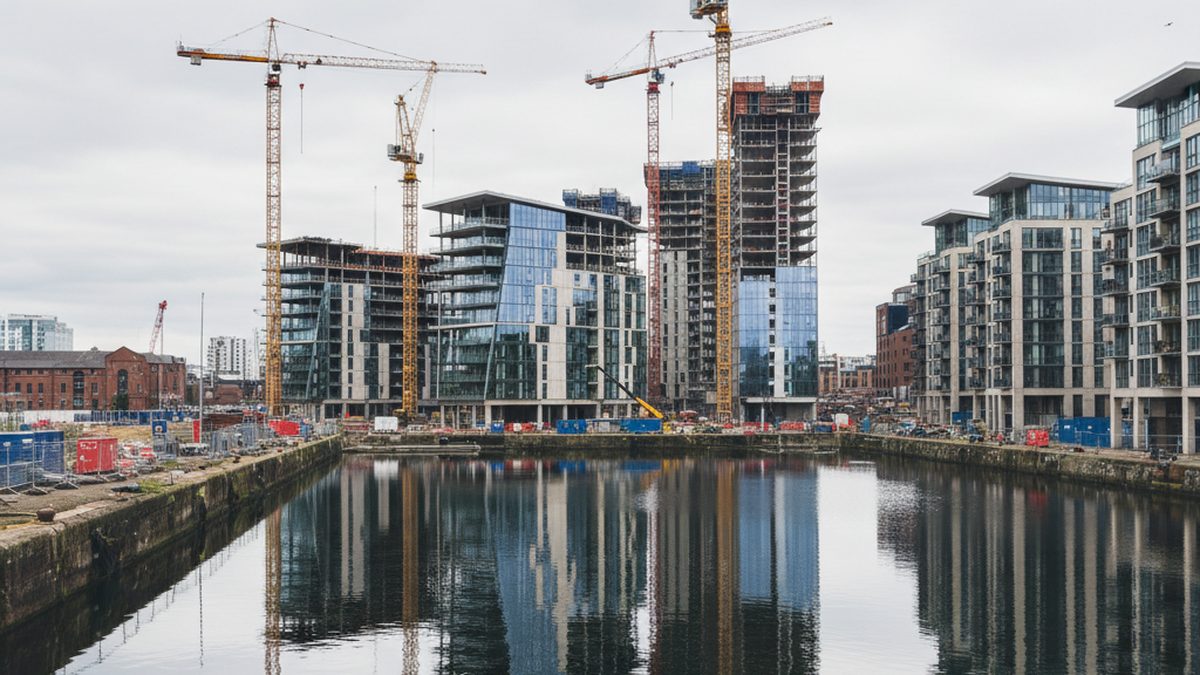
By sheer volume, the building boom has a clear capital, and it is east London.
| Outcode | Area | New homes sold |
|---|---|---|
| E14 | Canary Wharf / Docklands | 7,407 |
| E16 | Royal Docks | 3,545 |
| NW9 | Colindale | 3,344 |
| M15 | Manchester (Hulme) | 3,082 |
| SW11 | Battersea | 3,012 |
| PE7 | Peterborough (Hampton) | 2,877 |
The old East End docks lead the country. More than 7,000 new homes sold in the Canary Wharf postcode alone, with the neighbouring Royal Docks not far behind. Add Colindale in the north, Battersea in the south, and the Manchester and Peterborough entries, and you have a picture of intense, concentrated development in a small number of places rather than homes spread evenly across the country.
The Places Built From Scratch
The volume figures favour big cities. The more revealing measure is the share of the local market that is brand new, because that picks out the places that barely existed a decade ago.
| Outcode | Area | New-build share |
|---|---|---|
| E20 | Olympic Park, Stratford | 69% |
| DA10 | Ebbsfleet, Kent | 58% |
| M15 | Manchester (Hulme) | 57% |
| M50 | Salford Quays | 50% |
| B1 | Birmingham city centre | 51% |
At the top sits E20, a postcode that did not exist as a real place until the 2012 Olympics. Once a television invention used by EastEnders, it was assigned to the regenerated Olympic Park in Stratford, and today nearly seven in ten homes sold there are new builds. Ebbsfleet in Kent, a planned garden city on old quarry land, comes next. Then the city-centre transformations: Manchester, Salford Quays and central Birmingham, all places where flats have risen on former industrial land.
Brownfield Britain
Look down both lists and a theme jumps out. Canary Wharf and the Royal Docks were working docks. Salford Quays was a derelict port. The Olympic Park was contaminated industrial land. Ebbsfleet was a chalk quarry. Almost none of this is countryside being concreted over; it is old, used-up urban land being given a second life. Whatever you think of the towers that have gone up, the geography of the boom is overwhelmingly a story of brownfield regeneration, of cities rebuilding on top of their own industrial past.
What It Means
The pattern matters because it shapes who gets to live where. New-build hotspots are dominated by flats, they sell at a premium when they are first built, and they are concentrated in a handful of regeneration zones rather than spread across the towns that arguably need new housing most. If you are house-hunting, a high new-build share tells you a lot about an area: expect modern flats, expect leasehold, and expect a neighbourhood that is still finding its feet.
You can see the mix of recent sales, including new builds, for any area with our house prices by postcode tool. Every figure here comes from the public HM Land Registry Price Paid record.