


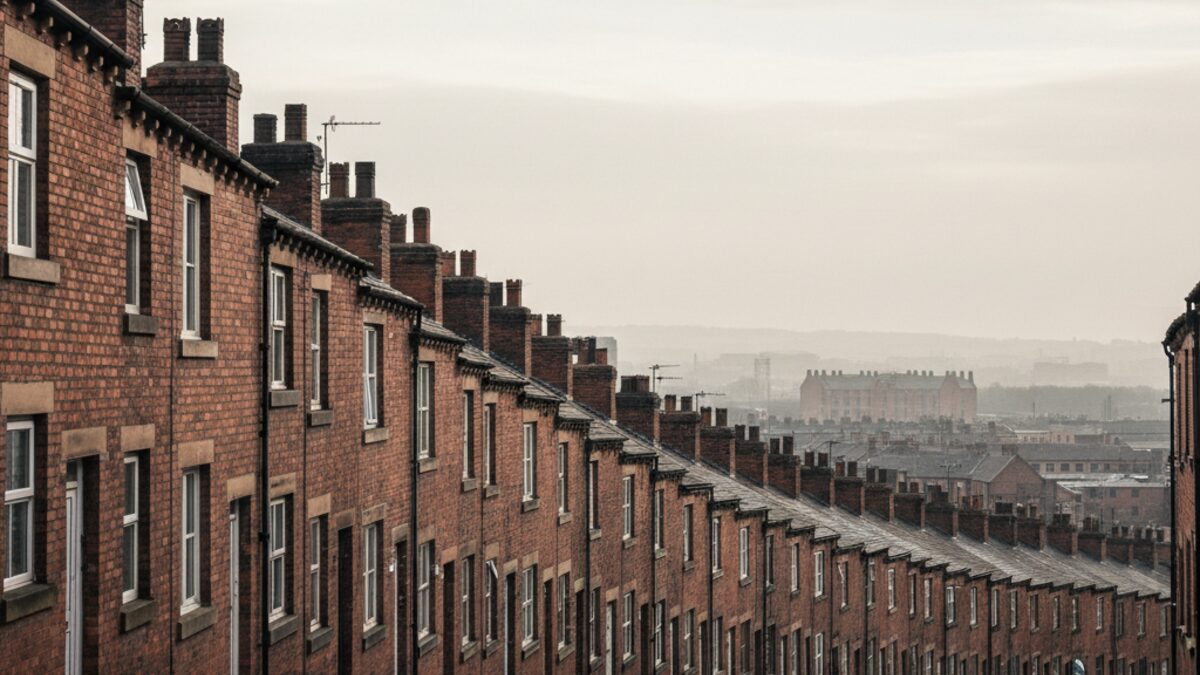
Walk down any street in a northern mill town and you will see them: rows of terraced houses, cheek by jowl, their front doors opening straight onto the pavement. This is the classic British streetscape, the backbone of our housing stock. But just how much of a backbone? The Land Registry's Price Paid Data, covering sales in England and Wales from 2018 to 2026, reveals a stark geography of the terrace. Nationally, 27.4% of all property sales were terraced houses. But that national figure hides a tale of two countries.
The Terraced Nation
The terrace is not evenly spread. It is a creature of the Industrial Revolution, of the rows built for mill workers and miners. In some postcodes, it is the dominant form of housing. In others, it is a rare curiosity. The data shows that the highest concentration of terraced sales is in Blackburn, where a remarkable 51.9% of all sales were terraced houses. Halifax follows at 48.3%, Oldham at 45.5%, and Sunderland at 42.1%. These are the places where the terrace still rules.
The Terraced Heartlands
The heartlands are the old northern mill and mining towns: Blackburn, Halifax, Oldham, Sunderland, Hull. And the south Wales valleys, too, with Cardiff showing a strong terrace presence. These are places built on industry, where workers needed to live close to the factory or the pit. The rows were the answer: cheap, efficient, and dense. Today, they remain the most common type of home in these areas, a living legacy of the 19th century economy.
| Postcode area | Sales that were terraced |
|---|---|
| BB (Blackburn) | 51.9% |
| HX (Halifax) | 48.3% |
| OL (Oldham) | 45.5% |
| SR (Sunderland) | 42.1% |
| CF (Cardiff) | 40.8% |
| HU (Hull) | 39.6% |
| BL (Bolton) | 39.4% |
| RM (Romford) | 39.2% |
| IG (Ilford) | 38.9% |
| DL (Darlington) | 38.4% |
Where The Rows Run Out
At the other end of the scale, the terrace is almost extinct. In the EC postcode of central London, just 2.2% of sales were terraced houses. In WC, it is 3.5%. The capital's historic core is a world of flats and mansion blocks, not two-up two-downs. And on the south coast, in Bournemouth, the figure is only 11.6%. Here, the Victorian and Edwardian villas and bungalows of the seaside resort dominate. The terrace, it seems, is a creature of the north and the valleys, not the metropolis or the coast.
| Postcode area | Sales that were terraced |
|---|---|
| EC (London) | 2.2% |
| WC (London) | 3.5% |
| BH (Bournemouth) | 11.6% |
| NW (London) | 14.7% |
| KT (Epsom) | 18.7% |
| CO (Colchester) | 18.8% |
| W (London) | 19% |
| GU (Woking) | 19.6% |
Why Here
The geography of the terrace is a map of Britain's industrial past. The towns with the highest proportions are those that grew explosively in the 19th century to house workers for cotton mills (Blackburn, Oldham, Halifax), coal mines (the south Wales valleys), and shipbuilding (Sunderland). The rows were built quickly and cheaply, often by the mill owners themselves, to pack as many workers as possible into a small area. In central London, by contrast, land was too valuable for such low-density housing; flats and tenements were the answer. On the south coast, the housing stock reflects a different history: retirement, tourism, and suburban expansion.
What It Means
This pattern matters for more than just historical curiosity. It shapes the housing market today. In terrace heartlands, the typical home is a small, often older property with limited parking and no garden. This keeps prices relatively low, but it also means that these areas are less attractive to families seeking space. In London and the south coast, the scarcity of terraces pushes buyers towards flats or more expensive detached homes. The data also hints at the challenges of retrofitting these old, often draughty, terraced houses for energy efficiency. And it reminds us that the British housing stock is not a single, uniform thing. It is a patchwork of local histories, each postcode telling its own story of industry, wealth, and the way we lived then. The terrace is a monument to that past, still standing, still selling, still shaping where we call home.