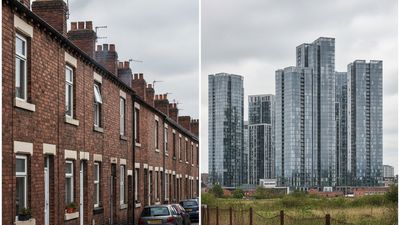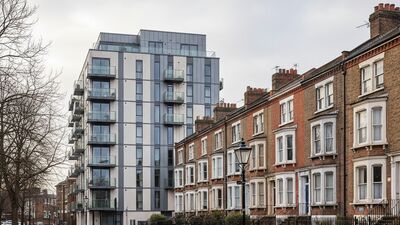
House or Flat? How Britain Lives, Mapped
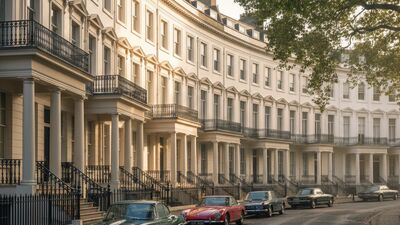
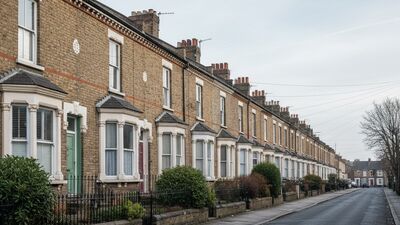
We sorted almost eight million property sales by type to find where flats dominate the market and where the terraced and semi-detached house still rules.
Read MoreArticles filed under Property
We sorted almost eight million property sales by type to find where flats dominate the market and where the terraced and semi-detached house still rules.
Read MoreThere have been 265,947 sales of a million pounds or more in England and Wales since 2018. We mapped where they cluster, both by sheer number and by share of the local market.
Read MoreWe mapped Census 2021 housing tenure across every postcode area in England and Wales to find where people are most likely to own their home, and where renting rules.
Read MoreMost homes have a number. Millions have a name instead. We counted them across every sale since 2018 to find the most common house names in England and Wales.
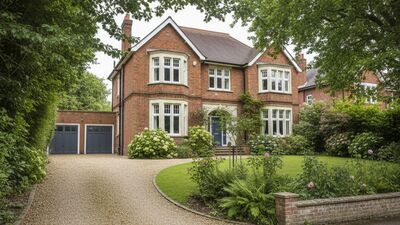
Read MoreIn some postcode areas a detached house costs more than four times the price of a flat. In others, barely twice. We mapped the gap between the grandest and the most modest homes.
Read MoreWe compared house prices in every postcode area in 2018 against 2025. The result turns the old story on its head: the cheapest corners of the North saw prices surge by 70 percent, while parts of prime central London actually fell.
Read MoreWe put a different UK postcode under the microscope every day at 12:30, and post every new data study as it lands. Follow along on Facebook.
Follow on Facebook