




The Guardian's recent taste test of supermarket mature cheddar has sent a ripple of longing through the nation's cheese lovers. The panel's search for that elusive "wonderfully rich and nutty" block, complete with the satisfying crunch of calcium lactate crystals, is a reminder that even the most everyday foods can be a source of deep pleasure. As a West Country native, the writer's insistence that cheddar should come from Cheddar strikes a chord: the village's limestone caves, with their stable temperatures and unique microbiome, are as much a part of the cheese's identity as the milk itself. The best examples, the panel found, deliver a complex flavour profile that mass-produced blocks simply cannot match.
But the reality of Britain's cheese supply is far removed from the bucolic image of Somerset maturing rooms. Most supermarket cheddar is produced in industrial creameries and distributed through a network that relies heavily on the country's major urban centres. The journey from a quiet farmhouse to the chiller cabinet is shaped by logistics, infrastructure, and the sheer physical scale of our cities. So while the taste test celebrates artisanal character, we at Postcodes UK wondered: what does the geography of our urban landscape look like, and how does it underpin the food we eat every day? After all, the cheese on your plate may have a postcode story of its own.
The UK's largest built-up areas
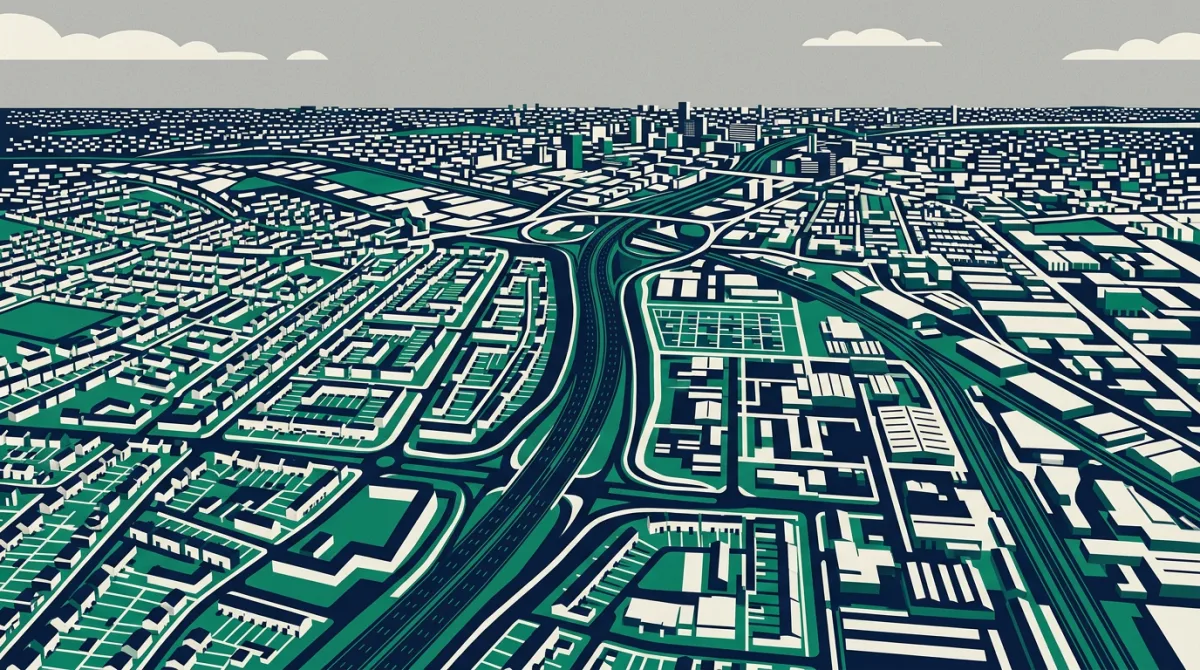
We examined our database of built-up area sises, which draws on official land use and census data to measure the continuous urban footprint of every town and city. The figures reveal a country dominated by sprawling conurbations, where the scale of development dwarfs the compact villages that often define our food heritage.
Rank | Built-up Area | Area (sq km)
1 | Birmingham (West Midlands) | 219.1
Birmingham tops this particular ranking, with a built-up area covering 219.1 square kilometres. That's a vast expanse of housing, industry, and retail; exactly the kind of environment where supermarket distribution centres, cold storage facilities, and transport hubs are located. The city's physical sise makes it a critical junction in the supply chain that delivers everything from mature cheddar to vegan alternatives across the Midlands and beyond. It's a world away from the intimate scale of a cheese maturing cave.
What cheese tells us about our cities
The disconnect between the artisan cheese ideal and the urban reality is more than a curiosity. It highlights how our food system is embedded in the built environment. While a small producer in Cheddar might mature their cheese in a cave, the block you pick up at your local supermarket has likely passed through a series of large-scale facilities situated in or around the country's biggest built-up areas. Birmingham's 219.1 square kilometres a number; it represents the sheds, loading bays, and road networks that keep the nation fed.
This isn't to diminish the value of traditional cheesemaking. If anything, the data underscores the importance of preserving those small-scale practices. The contrast between the intimate geography of Cheddar Gorge and the expansive urban sprawl of Birmingham reminds us that great food often comes from places that defy the logic of mass distribution. The next time you savour a tangy, crystalline cheddar, consider the two very different worlds that brought it to your plate: the ancient caves of Somerset and the concrete arteries of the West Midlands.
Urban creameries and independent cheesemongers are also part of this story, often operating within the very built-up areas our data describes. They prove that quality and place can still intersect, even in the heart of a city. But the sheer scale of Birmingham's footprint shows that for most of us, the cheese we eat is a product of a system designed for volume and reach. The postcode of your local supermarket probably sits within a built-up area that is, statistically, far larger than you might imagine.
The data behind this
The built-up area figures come from the HM Land Registry and the ONS census, processed through the Postcodes UK database. Our ranking focuses on continuous urban footprints as defined by the Office for National Statistics, excluding green spaces and non-urban land within boundaries. Birmingham's 219.1 square kilometres represents the total extent of its built-up area as of the latest release. For full details on how we compile these statistics, visit our methodology page.
In response to reporting by Guardian Money. Analysis and figures by Postcodes UK.