



Every league table we publish is about extremes. The most expensive, the most deprived, the highest, the oldest. This one runs the other way. We went looking for the place where nothing is remarkable at all: the postcode district that matches the national average more closely than anywhere else in Britain.
The winner is SP2, on the western side of Salisbury. Across seven measures, it sits closer to the middle of British life than any of the other 1,983 districts we scored.
What average actually looks like
Before crowning a winner, it helps to know what the middle of Britain is. Averaged across every qualifying postcode district, the typical British district looks like this: 20.2% of residents are over 65 and 17.9% are children. Just over 64% of homes are owned, and 19.8% are privately rented. The land sits 69 metres above sea level, a single postcode serves about 15 households, and the district lands slightly on the comfortable side of the official deprivation index.
Almost nowhere ticks every one of those boxes at once. Coastal districts skew old. City centres skew rented. The Pennines are too high, the Fens too low. Being average on one measure is easy. Being average on all seven at the same time is genuinely rare.
The most average places
| Rank | District | Town | Over 65 | Children | Owned | Privately rented |
|---|---|---|---|---|---|---|
| 1 | SP2 | Salisbury | 20.6% | 18.4% | 62.3% | 18.2% |
| 2 | CM7 | Braintree | 19.1% | 19.0% | 64.4% | 17.9% |
| 3 | DY10 | Kidderminster | 22.8% | 17.8% | 65.0% | 19.4% |
| 4 | NE21 | Blaydon-on-Tyne | 20.7% | 17.6% | 65.8% | 13.4% |
| 5 | ST16 | Stafford | 17.8% | 17.9% | 60.1% | 23.5% |
SP2 covers Salisbury's western suburbs, along with Wilton and a string of Wylye valley villages. Its residents are a shade older than the national norm and its home ownership a shade lower, but on every single measure it sits within touching distance of the middle. Its deprivation decile is 6 against a national mean of 5.6. Its average elevation is 66 metres against a national 69. A postcode there serves 13.8 households against a national 14.8.
The runners-up tell the same story four more times. Braintree, Kidderminster, Blaydon and Stafford are all medium-sized towns with a mix of estates and older streets, neither booming nor struggling. If a national retailer wanted one district to test an idea on before rolling it out, this table is where to look.
The least average places
Flip the ranking over and the pattern is just as clean. The four least average districts in Britain are S1 in Sheffield, LS2 in Leeds, L1 in Liverpool and NE1 in Newcastle. All four are big city centres, and all four miss the national norm by a distance on nearly every count at once: hardly any children, hardly any pensioners, hardly any owner-occupiers, and a rented, low-lying, densely packed population that looks nothing like the country as a whole.
There is a neat irony in that. The postcode districts we treat as the public face of our great cities are, statistically, the least representative places in the country.
How we worked it out
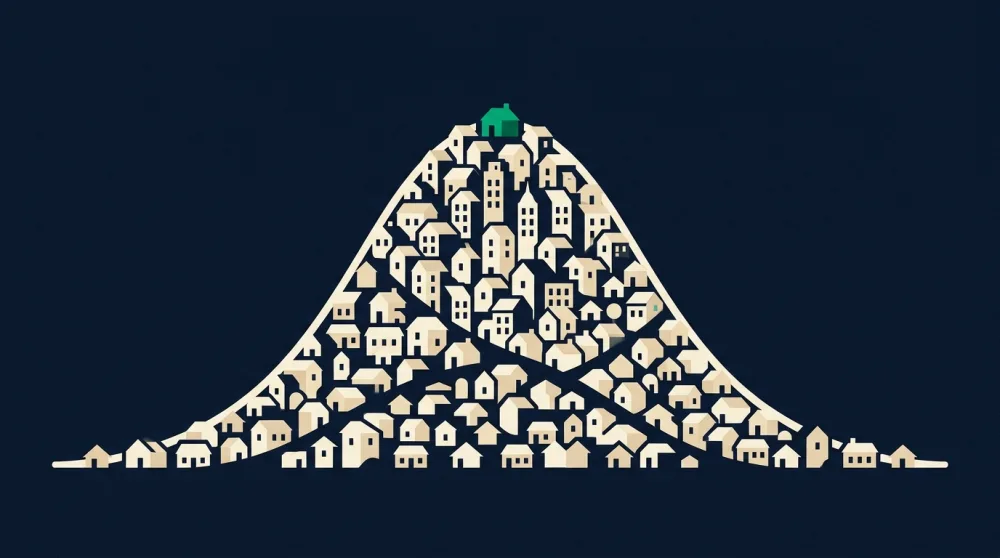
We took every postcode district in Britain with at least 1,500 households and complete data, which left 1,984 of them. For each we compared seven measures against the national average: the share of residents over 65, the share of children, the share of owned homes, the share of privately rented homes, the official deprivation decile, the mean elevation of its postcodes, and the number of households served by a typical postcode. Each gap was expressed in standard deviations so that no single measure dominates, then summed. The smallest total wins. Population data comes from the ONS census, deprivation from the official index for England, and elevation from our own dataset of 1.79 million postcode heights.
Explore any district yourself with the area profile tool, or look up SP2 in full.