



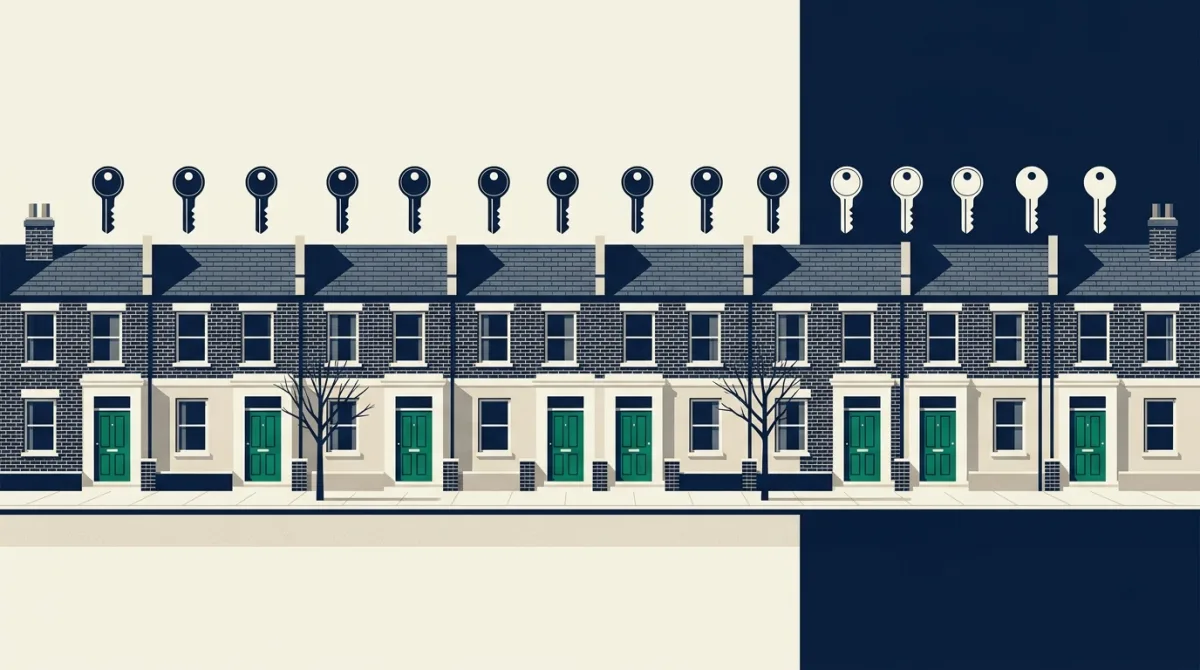
The postcode district ST9, covering parts of Stoke-on-Trent in the West Midlands, records the highest home ownership rate in England and Wales. Here, 90.2 per cent of households own their home, compared with a national average of 62.6 per cent.
That means in ST9, fewer than one in ten homes is rented. The gap between this district and the country as a whole is more than 27 percentage points, a stark reminder of how uneven property tenure can be across the UK. The rest of the top ten, displayed in the table below, each show ownership rates well above the national baseline.
Inside ST9: Britain’s ownership hotspot
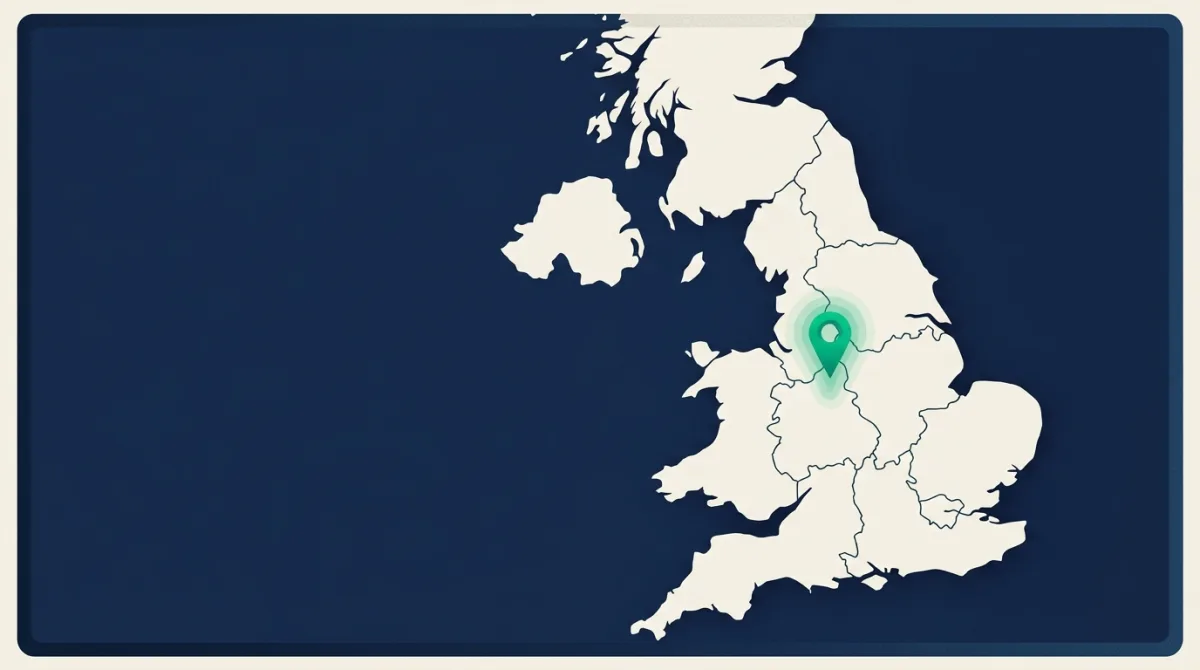
ST9 sits within the Stoke-on-Trent conurbation, extending into neighbouring Staffordshire Moorlands. Its built environment mixes suburban estates with semi-rural pockets. While the data cannot pinpoint a single cause, high ownership rates in such areas often reflect a combination of relatively affordable house prices, an older age profile and a settled population with fewer transient renters. The Land Registry’s price data for ST9 shows a median property value below the national figure, though a precise comparison depends on property type.
It is worth looking at the census geography: ST9 is a postcode district, not a local authority. The 2021 ONS census counted households in each such area, recording tenure status. In ST9, owner-occupier households dominate to an extent rarely seen elsewhere. The table that follows ranks all postcode districts with at least one thousand households by their ownership rate, revealing the ten places where renting is the exception.
The top ten postcodes by home ownership
| District | Post town | Region | Homes owned |
|---|---|---|---|
| ST9 | Stoke-on-Trent | West Midlands | 90.2% |
| BH18 | Broadstone | South West | 90.0% |
| L16 | Liverpool | North West | 89.2% |
| TS22 | Billingham | North East | 88.7% |
| SS5 | Hockley | East of England | 87.8% |
| CH60 | Wirral | North West | 87.3% |
| DA13 | Gravesend | South East | 87.1% |
| L37 | Liverpool | North West | 86.7% |
| NE20 | Newcastle upon Tyne | North East | 86.6% |
| BR4 | West Wickham | London | 86.3% |
The table makes clear that ST9 does not stand alone. Several other districts within the top ten register ownership rates above 85 per cent. Together, these postcodes are scattered across different regions, yet they share certain structural features that tilt the housing market towards owner-occupation. In each case, the social rented and private rented sectors account for a much smaller footprint than the national picture would suggest.
Why such high ownership matters
A neighbourhood where almost every property is owned rather than rented can feel and function differently. Residential turnover may be lower, community ties stronger, and the housing stock less subject to short-term landlord investment. On the other hand, areas with extremely high ownership can be less accessible to younger households or those who cannot secure a mortgage, potentially reducing economic diversity. The postcodes in our top ten are not immune to these dynamics, but their ownership figures show a housing ladder that, once climbed, is rarely descended.
Nationally, the 62.6 per cent owner-occupier rate has edged downwards over recent decades. Against that backdrop, districts like ST9 stand out as outliers, preserving ownership levels reminiscent of the late twentieth century.
How we worked it out
Ownership rates were calculated from the 2021 ONS census, which asks households their tenure. We used the count of owner-occupied households as a percentage of all households in each postcode district. Districts with fewer than one thousand total households were excluded to ensure statistical reliability. The national average of 62.6 per cent is a weighted mean across all included districts. Data on local house prices comes from HM Land Registry’s price paid dataset, and district boundaries correspond to Postcodes UK’s own postcode database. For full details, see our methodology note.