



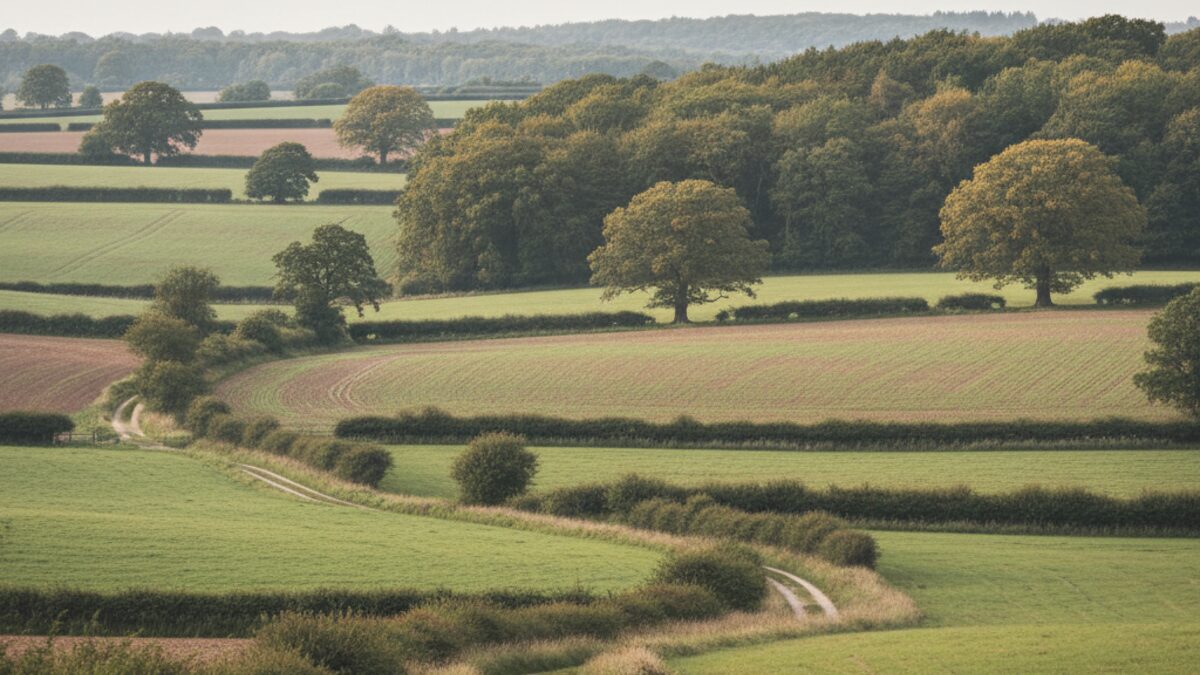
Nottinghamshire is a county of contrasts, a place where the gentle hills of the countryside meet the bustle of market towns and former mining communities. With a population of about 1,329,716 spread across 31 postcode districts, it is home to towns such as Beauvale, Gamston, Skegby, Woodthorpe, Mapperley and Bestwood. These places hint at the diversity within: from the leafy exclusivity of Southwell to the industrial heritage of Worksop. The numbers tell a story of a county that offers both rural tranquillity and suburban convenience, but also reveals sharp differences in wealth, property prices and opportunity.
At a Glance
Nottinghamshire at a glance
- Population: about 1,329,716
- Postcode districts: 31
- Average sale price: £253,124 (-27% vs the England and Wales average)
- Schools rated Outstanding: 8.7% (35 of 402)
Nottinghamshire covers 31 postcode districts and houses roughly 1.33 million people. The average property sale price across the county is £253,124, a figure that sits 27 per cent below the England and Wales average. At the top of the market is NG25 (Southwell) with an average price of £416,324; at the bottom is S80 (Worksop) at £172,138, a gap of about 2.4 times. The average Index of Multiple Deprivation decile for the county is 5.5 out of 10, ranging from a more deprived 3 to a much wealthier 8. Of the 402 Ofsted-rated schools, 8.7 per cent have achieved the top grade of Outstanding.
The Property Divide
| Postcode district | Average price | |
|---|---|---|
| Most expensive district | NG25 (Southwell) | £416,324 |
| Least expensive district | S80 (Worksop) | £172,138 |
The property market in Nottinghamshire is a tale of two extremes. In Southwell, the most expensive district (NG25), the average home costs £416,324, more than double the county average. This historic minster town, with its Georgian architecture and rural charm, commands a premium that reflects its desirability. Meanwhile, in Worksop (S80), the average price is just £172,138, making it the cheapest district in the county. The ratio between the two is 2.4 to one, a striking gap that underscores the economic divide between Nottinghamshire's affluent south-west and its more industrial northern edge. These figures also sit in context: the county average is 27 per cent below the national average, meaning that even Southwell's top-end prices are not astronomically high by national standards. But for many buyers, the difference between a Southwell house and a Worksop home is the difference between a semi-detached and a detached, or between a short commute and a longer one.
Rich and Poor
Deprivation in Nottinghamshire is not evenly spread. The Index of Multiple Deprivation decile for the county sits at an average of 5.5 out of 10, placing it almost exactly in the middle of the national scale. But the range from 3 to 8 reveals real variation. A score of 8 suggests districts where residents enjoy relatively high incomes, good health and low crime; a score of 3 points to areas where poverty, unemployment and poor housing are more common. The gap between the most and least deprived parts of the county is not as wide as in some other areas of England, but it is significant. The cheaper housing in Worksop correlates with higher deprivation, while Southwell's expensive properties sit in a district that likely fares better on many measures. This pattern is common: where house prices are highest, deprivation tends to be lowest, and vice versa.
Schools
Education in Nottinghamshire shows a mixed picture. Of the 402 schools that have been inspected by Ofsted, only 8.7 per cent hold the top grade of Outstanding. That is below the national average of around 12 to 15 per cent in recent years, suggesting that while there are some excellent schools, the county as a whole has room to improve. The remaining schools are rated Good, Requires Improvement or Inadequate. The concentration of Outstanding schools may well be higher in wealthier districts; parents in Southwell, for instance, often have a wider choice of high-performing schools, while those in Worksop may find fewer options. This can add to the property price premium in areas with sought-after schools, reinforcing the cycle of advantage and disadvantage.
The Bottom Line
Nottinghamshire is a county of measured contrasts. Its property market, with a 2.4 times gap between the dearest and cheapest districts, reflects a broader divide in wealth and opportunity. The average home is affordable compared with England and Wales, but that masks a significant split: one in which Southwell and Worksop sit at opposite ends of the spectrum. Deprivation levels are middling on average, but the range from 3 to 8 shows that some communities face real challenges while others enjoy considerable comfort. Schools, too, are a mixed bag, with fewer than one in ten rated Outstanding. For anyone looking to move to the county, the numbers offer a clear message: where you choose to live in Nottinghamshire can make a very big difference to both your wallet and your quality of life.